Multiple Choice
Exhibit 10.6
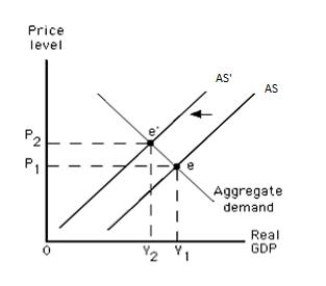
-Refer to Exhibit 10.6 which shows the equilibrium price level and real GDP in an aggregate demand-aggregate supply model. Which of the following economic changes is depicted by a movement from point e to point e'?
A) an increase in short-run aggregate supply
B) an increase in long-run aggregate supply
C) a decrease in short-run aggregate supply
D) a decrease in long-run aggregate supply
E) an increase in the aggregate quantity demanded
Correct Answer:
Verified
Related Questions
Q82: Which of the following is true when
Q97: Which of the following is true in
Q123: If resource prices are "sticky" downward and
Q125: Exhibit 10.7 Q126: An increase in aggregate demand in the
![]()

