The figure below is an example of data that are in: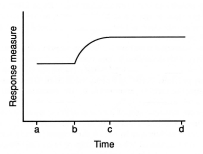
A) a steady state
B) a cycle
C) a transitory state
D) a transition state
Correct Answer:
Verified
Q14: _ is a measure of variability defined
Q15: A _ is a repeating pattern of
Q16: A pattern of responding involving change from
Q17: Identifying transition and transitory states is a
Q18: Just because some aspect of responding is
Q20: When comparing the responding in the two
Q21: What is the major consideration of all
Q22: What are repeated measures of behavior? Why
Q23: What is the goal for comparing different
Q24: How do repeated observations of a participants'
Unlock this Answer For Free Now!
View this answer and more for free by performing one of the following actions

Scan the QR code to install the App and get 2 free unlocks

Unlock quizzes for free by uploading documents