Refer to the graph below.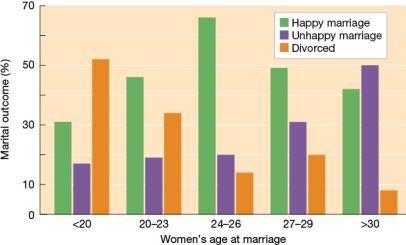 Which is an accurate conclusion, based on the data shown?
A) The likelihood of an unhappy marriage decreases the longer women wait to marry.
B) Women who marry in their early twenties are the most likely to get divorced.
C) Divorce rates among people who marry in their thirties are higher than any other age group.
D) More women who marry after turning thirty are happily married than are unhappily married.
Correct Answer:
Verified
Q113: Charles grew up in Georgia but has
Q114: A teacher assigns his class a group
Q115: The behavior of the participants in Zimbardo's
Q116: _ is a paradox in decision analysis
Q117: What is the best definition of neuroeconomics?
A)
Q119: Evaluate the following relationships and select the
Q120: For years, psychologists have investigated the effect
Q121: Refer to the table below, showing results
Q122: Refer to the table below, showing results
Q123: Refer to the table below, showing results
Unlock this Answer For Free Now!
View this answer and more for free by performing one of the following actions

Scan the QR code to install the App and get 2 free unlocks

Unlock quizzes for free by uploading documents