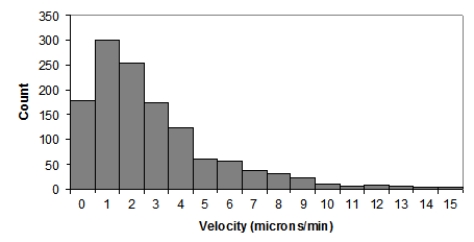
Here is a histogram of T-cell velocities in vitro (in microns per minute) :
Which of the following statements is NOT true?
A) The population distribution of T-cell velocities is most likely skewed to the right.
B) The distribution of T-cell velocities would be more Normal if the researchers had collected more data.
C) When n is large, the sampling distribution of average T-cell velocities is approximately Normal.
D) The sampling distribution of average T-cell velocities for samples of size n = 10 is very likely right-skewed.
Correct Answer:
Verified
Q38: The distribution of total body protein in
Q39: The distribution of total body protein in
Q40: The distribution of total body protein in
Q41: The distribution of vitamin C amount in
Q42: The distribution of vitamin C amount in
Q43: The distribution of vitamin C amount in
Q45: The World Health Organization estimates that 5%
Q46: The World Health Organization estimates that 5%
Q47: The state of California reported a total
Q48: The state of California reported a total
Unlock this Answer For Free Now!
View this answer and more for free by performing one of the following actions

Scan the QR code to install the App and get 2 free unlocks

Unlock quizzes for free by uploading documents