A researcher was interested in the lengths of brook trout and obtained the following quantile-quantile plot for determining the Normality of the distribution: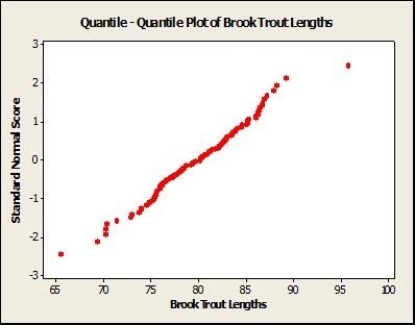 Based on this graph, what is the best description of the data?
A) Standard Normal
B) Normal, but not standard Normal
C) Skewed left
D) Skewed right
Correct Answer:
Verified
Q33: The amount of cholesterol in a person's
Q34: The amount of cholesterol in a person's
Q35: X has a Normal distribution with mean
Q36: Using fluorescent imaging techniques, researchers observed that
Q37: Using fluorescent imaging techniques, researchers observed that
Q38: Using fluorescent imaging techniques, researchers observed that
Q40: A researcher was interested in the survival
Q41: The following Normal quantile plot displays the
Q42: The following Normal quantile plot displays the
Q43: The birth weights of a random sample
Unlock this Answer For Free Now!
View this answer and more for free by performing one of the following actions

Scan the QR code to install the App and get 2 free unlocks

Unlock quizzes for free by uploading documents