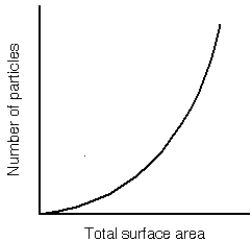
-The diagram above depicts how the total surface area of a rock varies with the number of particles for a fixed volume of rock. Based on this diagram, what can be said about the ratio of surface area to volume?
A) The ratio decreases as the number of particles increases.
B) The ratio increases as the number of particles increases.
C) The ratio first decreases then increases as the number of particles increases.
D) The ratio does not depend on the number of particles.
Correct Answer:
Verified
Q19: Which does not increase the strength of
Q20: How many planes of cleavage are necessary
Q21: Color is generally a good diagnostic property
Q22: A basalt is an example of a(n)
Q23: Which of the following minerals is commonly
Q25: Clastic sediments are lithified into rock by
A)
Q26: Layering in sediments and sedimentary rocks is
Q27: What is the most important factor that
Q28: Which of the following do all igneous
Q29: Complete the following sentence. Extrusive igneous rocks
Unlock this Answer For Free Now!
View this answer and more for free by performing one of the following actions

Scan the QR code to install the App and get 2 free unlocks

Unlock quizzes for free by uploading documents