3) A problem with the chart shown below is that: Figure 1 Mean reading times (secs.) for trained and untrained groups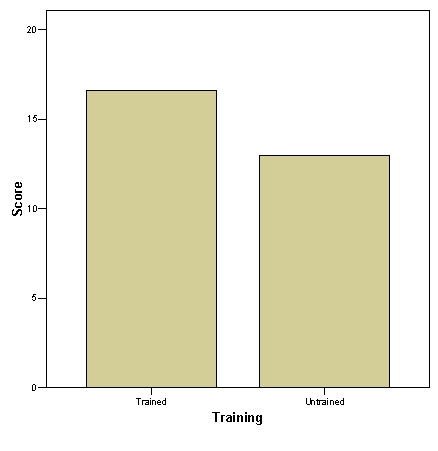
A) The X axis labelling is inadequate
B) The Y axis labelling is inadequate
C) The Y axis starts from zero
D) The two bar columns should be joined together
Correct Answer:
Verified
Q1: 1) In a bar chart:
A) It is
Q2: 2) The following stem and leaf
Q4: 4) In a histogram:
A) Columns can represent
Q5: 5) A bar chart representing scores from
Q6: 6) When putting charts into reports:
A) It
Q7: 7) In a bar chart:
A) Columns cannot
Q8: 8) Which of the following is true:
A)
Q9: 9) A frequency polygon:
A) Shows the mean
Q10: 10) A stem and leaf chart:
A) Does
Unlock this Answer For Free Now!
View this answer and more for free by performing one of the following actions

Scan the QR code to install the App and get 2 free unlocks

Unlock quizzes for free by uploading documents