Figure 13-2
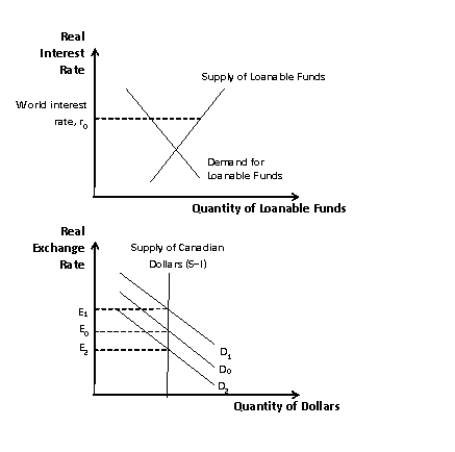
-Refer to the FigurE₁3-2.Which of the following shifts shows the effects of an import quota?
A) a shift of the supply of Canadian dollars (S-I) curve to the right
B) a shift from D₀ to D₁
C) a shift from D₀ to D₂
D) a shift of the demand for loanable funds curve to the right
Correct Answer:
Verified
Q105: Figure 13-2 Q105: Which of the following is the most Q106: Figure 13-2 Q107: Suppose Canada imposes an import quota on Q108: Which of the following best defines capital Q109: If the Canadian government imposes an import Q109: When Mexico suffered from capital flight in Q112: Suppose that Canada imposes restrictions on the Q113: Suppose that Canada imposes an import quota Q114: Figure 13-2 Unlock this Answer For Free Now! View this answer and more for free by performing one of the following actions Scan the QR code to install the App and get 2 free unlocks Unlock quizzes for free by uploading documents
![]()
![]()
![]()

