Refer to the figure.
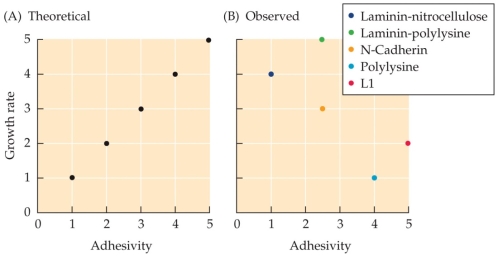 These data are from an experiment using growth cones cultured on substrates with different levels of adhesivity, ranked from least adhesive (laminin-nitrocellulose) to most adhesive (L1). Based on the theoretical prediction in graph A, what was the researchers' hypothesis about adhesivity and growth cone growth rate? Based on the observed data in graph B, how does growth rate actually correlate to adhesivity? What does this suggest about the role of adhesion in axonal growth?
Correct Answer:
Verified
Q22: If you wanted to determine whether motor
Q23: Axonal growth cones from amphibian retinal ganglion
Q24: Conditions resulting in the total or partial
Q25: Corpus callosum axons grow toward the midline
Q26: What is the difference between anterograde and
Q28: In growth cone guidance, what is the
Q29: What mechanism of axonal growth do the
Q30: What is one possible reason that the
Q31: Why do neurons that cross the midline
Q32: Refer to the figure.
![]()
Unlock this Answer For Free Now!
View this answer and more for free by performing one of the following actions

Scan the QR code to install the App and get 2 free unlocks

Unlock quizzes for free by uploading documents