The following graph illustrates a study on the effects of a teaching intervention across teaching sessions. The graph illustrates that a ______ quasi-experimental design in which the intervention ______ math test scores compared to the control group. The graph shows the means for the groups on a math tests which can range from 0 to 10.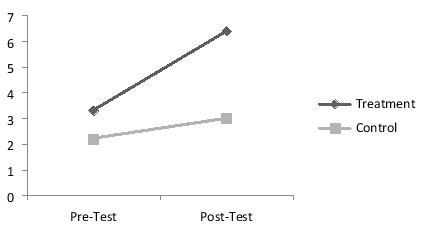
A) Time series; improved
B) Non-Equivalent Control Group; had no effect on
C) Time series; had no effect on
D) Non-Equivalent Control Group; improved
Correct Answer:
Verified
Q4: What is the threat to the internal
Q5: A researcher begins a 3-year study on
Q6: Which of the following is a reason
Q7: Which design feature is unique to a
Q8: A psychologist wants to compare the effects
Q10: What is accounted for by using non-equivalent
Q11: A candy company wants to measure the
Q12: Potential problems with repeated measures design include:
A)
Q13: Post-intervention treatment scores in a clinical trial
Q14: Which of these examples is a potential
Unlock this Answer For Free Now!
View this answer and more for free by performing one of the following actions

Scan the QR code to install the App and get 2 free unlocks

Unlock quizzes for free by uploading documents