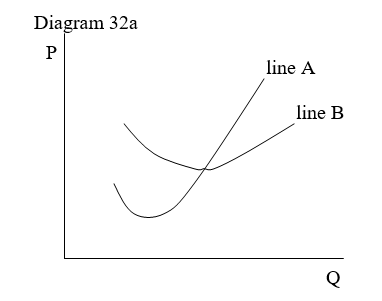
-Identify the curves shown in Diagram 32a
A) line A is the average cost curve; line B is the marginal cost curve.
B) line A is the total cost curve; line B is the average cost curve.
C) line A is the marginal cost curve; line B is the average cost curve.
D) line A is the supply curve; line B is the demand curve.
Correct Answer:
Verified
Q20: Explain the dynamics of the competitive market
Q21: Explain the dynamics of the competitive market
Q22: Which market structure(s) is characterized by a
Q23: The term, "price taker" means that
A) a
Q24: Atlas Flour finds that the market price
Q25: Assume that a small firm, Blue Mill
Q26: Assume that a small firm, Blue Mill
Q27: What is the definition of marginal cost?
A)
Q29: Assume that Dubuque Flour Company is currently
Q30: Assume that Boise Flour Company is currently
Unlock this Answer For Free Now!
View this answer and more for free by performing one of the following actions

Scan the QR code to install the App and get 2 free unlocks

Unlock quizzes for free by uploading documents