Which of the figures correctly represents the shape of the IS curve?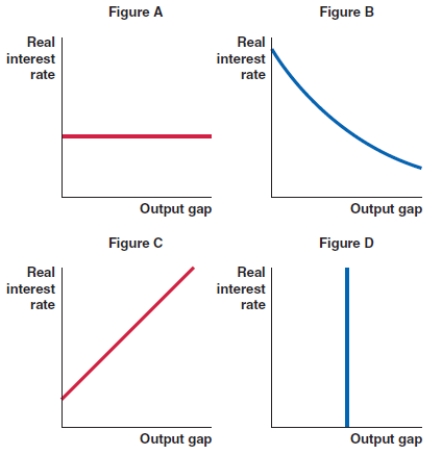
A) Figure A
B) Figure B
C) Figure C
D) Figure D
Correct Answer:
Verified
Q38: What is the relationship between lower interest
Q39: What is the relationship between higher interest
Q40: The lower the opportunity cost of consumption,
Q41: The higher the opportunity cost of consumption,
Q42: The IS curve performs the function of
Q44: A fall in the real interest rate
Q45: A rise in the real interest rate
Q46: Which of the following causes shifts in
Q47: The Kenyan government constructs a new intercity
Q48: The Ugandan shilling depreciates. How does this
Unlock this Answer For Free Now!
View this answer and more for free by performing one of the following actions

Scan the QR code to install the App and get 2 free unlocks

Unlock quizzes for free by uploading documents