During the Great Recession of 2007 to 2009, banks began to make fewer loans as they became wary of risky projects. Which of the following graphs shows the effect on the investment line?
A) 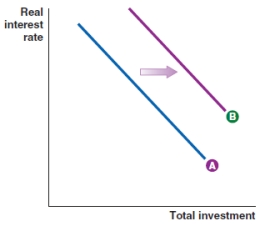
B) 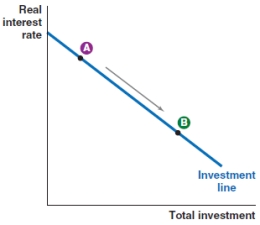
C) 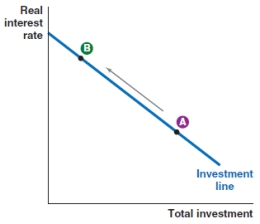
D) 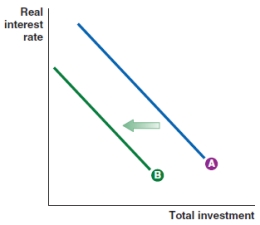
Correct Answer:
Verified
Q57: Which of the following graphs shows what
Q58: Which of the following graphs shows what
Q59: Which of the following graphs shows what
Q60: A credible forecast indicates that the economy
Q61: A new administration arrives in Washington,
A)
Q63: Banks become willing to take on riskier
Q64: The loanable funds market is the market
Q65: The loanable funds market is the market
Q66: The borrowers in the loanable funds market
Q67: The suppliers in the loanable funds market
Unlock this Answer For Free Now!
View this answer and more for free by performing one of the following actions

Scan the QR code to install the App and get 2 free unlocks

Unlock quizzes for free by uploading documents