Which of the following graphs shows the correct effect on the consumption function when there is an increase in real interest rates and the substitution effect is dominant?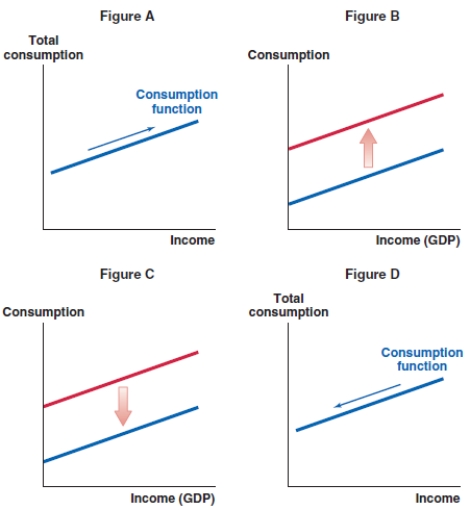
A) Figure A
B) Figure B
C) Figure C
D) Figure D
Correct Answer:
Verified
Q41: The opportunity cost of an extra dollar
Q42: The benefit of an extra dollar of
Q43: The rational rule of consumption is to
Q44: When consumers receive more income, their spending:
A)increases.
B)increases
C)decreases.
D)decreases
E)stays
Q45: Which of the following graphs shows the
Q47: Which of the following graphs shows the
Q48: Why does a temporary change in income
Q49: Why does an anticipated change in income
Q50: When does an anticipated change in future
Q51: Which of the following graphs shows the
Unlock this Answer For Free Now!
View this answer and more for free by performing one of the following actions

Scan the QR code to install the App and get 2 free unlocks

Unlock quizzes for free by uploading documents