Consider these four graphs of the labor market, showing four different minimum wage levels. Which graph(s) shows a wage level where there is an excess supply of workers?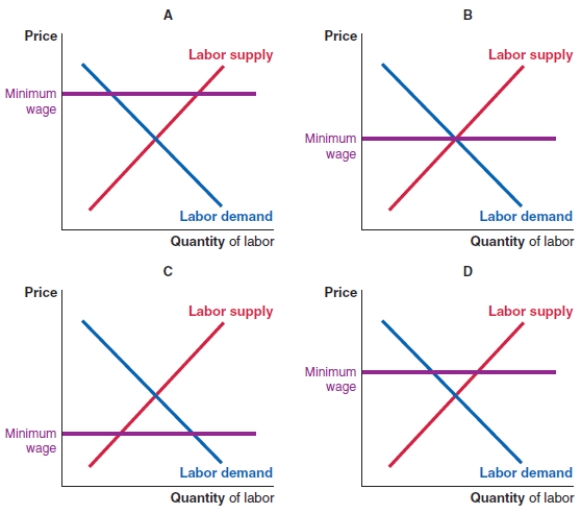
A) graphs A and D
B) graph B
C) graphs A and C
D) graphs B and C
Correct Answer:
Verified
Q56: The table shows statistics for three Canadian
Q57: Structural unemployment is unemployment:
A)due to a temporary
Q58: Frictional unemployment is unemployment:
A)due to a temporary
Q59: Cyclical unemployment is unemployment:
A)due to a temporary
Q60: Consider these four graphs of the labor
Q62: Consider these four graphs of the labor
Q63: Consider these four graphs of the labor
Q64: Consider the graph of the labor market
Q65: Consider the graph of the labor market
Q66: Consider the graph of the labor market
Unlock this Answer For Free Now!
View this answer and more for free by performing one of the following actions

Scan the QR code to install the App and get 2 free unlocks

Unlock quizzes for free by uploading documents