(Figure: Competitive Equilibrium in the Labor Market) Use Figure: Competitive Equilibrium in the Labor Market. In the figure, an increase in demand of the good produced will, all else equal, lead to a(n) _____ in the equilibrium quantity of labor and a(n) _____ in the equilibrium price of labor. 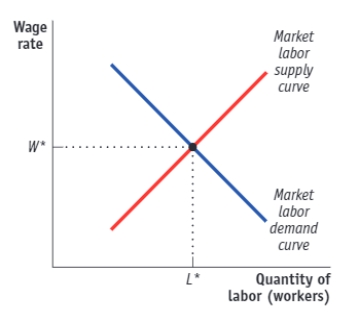
A) increase; increase
B) decrease; increase
C) increase; decrease
D) decrease; decrease
Correct Answer:
Verified
Q192: The government of Florida is considering raising
Q193: A labor demand curve may shift to
Q194: A decrease in the demand for autoworkers
Q195: A shift in the demand for labor
Q196: (Figure: Competitive Equilibrium in the Labor Market)
Q198: (Figure: Competitive Equilibrium in the Labor Market)
Q199: (Table: Total Product of Labor at
Q200: (Table: Total Product of Labor at
Q201: (Table: Total Product of Labor at
Q202: (Table: Total Product of Labor at
Unlock this Answer For Free Now!
View this answer and more for free by performing one of the following actions

Scan the QR code to install the App and get 2 free unlocks

Unlock quizzes for free by uploading documents