(Figure: Market 3) Use the graph to answer the question.
The graph shows the marginal social cost, demand, and supply curves in the toothpaste market. If market forces prevail, this market will produce and sell _____ tubes of toothpaste at a price of _____.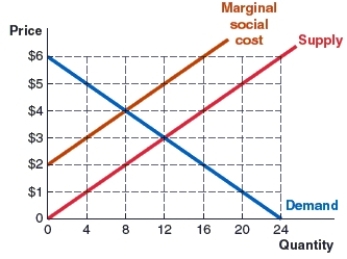
A) eight; $5
B) eight; $4
C) 12; $3
D) 12; $4
Correct Answer:
Verified
Q69: Which step is omitted from the
Q70: What step is omitted from the
Q71: (Figure: Market) Use the graph to answer
Q72: (Figure: Market) Use the graph to answer
Q73: (Figure: Market 2) Use the graph to
Q75: (Figure: Market 3) Use the graph to
Q76: (Figure: Market 3) Use the graph to
Q77: By contrast with a market that produces
Q78: A market with negative externalities will tend
Q79: The socially optimal amount of an externality
Unlock this Answer For Free Now!
View this answer and more for free by performing one of the following actions

Scan the QR code to install the App and get 2 free unlocks

Unlock quizzes for free by uploading documents