(Figure: Market 2) Use the graph to answer the question.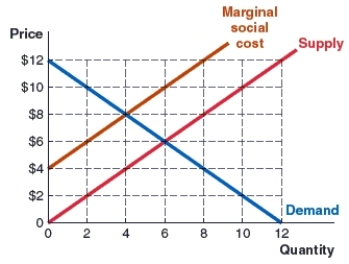
The graph shows the marginal social cost, demand, and supply curves in the cinnamon roll market. A corrective tax of _____ per unit will move the cinnamon roll market to the socially optimal output of _____ units.
A) $4; 4
B) $8; 4
C) $6; 6
D) $2; 6
Correct Answer:
Verified
Q94: What conditions must be met for private
Q95: A tax designed to induce people to
Q96: _ tax is designed to encourage people
Q97: A corrective tax leads:
A)to a reduction of
Q98: (Figure: Market 3) Use the graph to
Q100: What happens in a supply and demand
Q101: A corrective tax designed to resolve a
Q102: Which of the following is the amount
Q103: A corrective subsidy:
A)removes choice by requiring production
Q104: Which of the following is NOT an
Unlock this Answer For Free Now!
View this answer and more for free by performing one of the following actions

Scan the QR code to install the App and get 2 free unlocks

Unlock quizzes for free by uploading documents