(Figure: Market 3) Use the graph to answer the question.
The graph shows the marginal social cost, supply, and demand curves in the hand sanitizer market. At what quantity could the government set a quota to control this externality?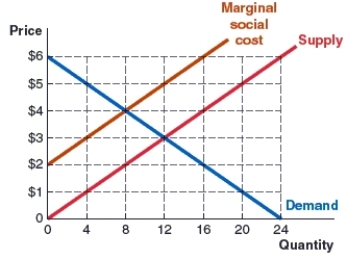
A) 2
B) 4
C) 8
D) 12
Correct Answer:
Verified
Q103: A corrective subsidy:
A)removes choice by requiring production
Q104: Which of the following is NOT an
Q105: Which of the following is NOT an
Q106: The production of a particular good generates
Q107: (Figure: Market 8) Use the graph to
Q109: Quotas change _, and taxes change _
Q110: What determines whether a corrective tax or
Q111: When a quota is used to control
Q112: "Cap and trade" means that each business
Q113: Why would the government allow companies to
Unlock this Answer For Free Now!
View this answer and more for free by performing one of the following actions

Scan the QR code to install the App and get 2 free unlocks

Unlock quizzes for free by uploading documents