(Figure: Imports and Exports) During the 2008 to 2009 financial crisis, exports as a share of GDP fell in the United States. Which of the following could explain this phenomenon?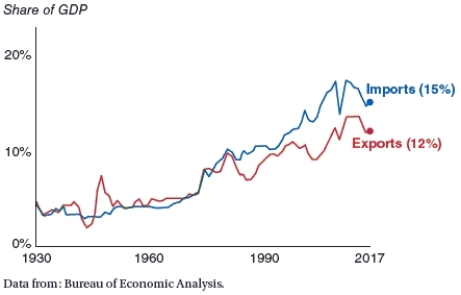
A) The percentage decrease in exports was greater than the percentage decrease in GDP.
B) The percentage decrease in exports was less than the percentage decrease in GDP.
C) The percentage increase in exports was greater than the percentage decrease in GDP.
D) The percentage increase in exports was less than the percentage decrease in GDP.
Correct Answer:
Verified
Q24: Which of the following is LEAST likely
Q25: Which of the following is MOST likely
Q26: Which of the following is LEAST likely
Q27: (Figure: Imports and Exports) From 1930 to
Q28: (Figure: Imports and Exports) During the 2008
Q30: Which of the following is NOT a
Q31: Which of the following is NOT a
Q32: Which of the following is a source
Q33: Which of the following is a source
Q34: The United States has a comparative advantage
Unlock this Answer For Free Now!
View this answer and more for free by performing one of the following actions

Scan the QR code to install the App and get 2 free unlocks

Unlock quizzes for free by uploading documents