(Figure: Monthly Demand for Potato Chips) The graph Monthly Demand for Potato Chips shows one individual's linear monthly demand curve for potato chips. At $5 per bag of chips, this individual will consume 10 bags in a month. How much consumer surplus does this consumer receive?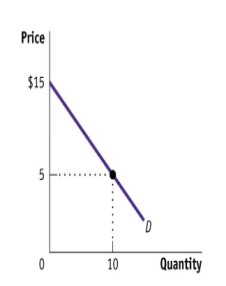
A) $100
B) $50
C) $150
D) $500
Correct Answer:
Verified
Q151: Which statement makes use of positive analysis?
A)Rent-controlled
Q152: Which statement is normative?
A)Scientists should not make
Q153: Positive analysis is about:
A)what is.
B)the normalizing assumptions
Q154: Positive analysis in economics:
A)makes prescriptions about how
Q155: Normative analysis in economics:
A)makes prescriptions about how
Q157: Eliana and Olivia are at Barnes and
Q158: Violet and Allegra are shopping together at
Q159: (Figure: Wireless Keyboard Market) Use the graph
Q160: (Figure: Market Demand for Oranges) Consider the
Q161: Brianna and India are shopping together at
Unlock this Answer For Free Now!
View this answer and more for free by performing one of the following actions

Scan the QR code to install the App and get 2 free unlocks

Unlock quizzes for free by uploading documents