(Figure: Tax on Seller) In the graph shown, the original equilibrium price is $50. A $6 tax is placed on the seller in this market. As a result of the tax, the equilibrium quantity in the market changed from _____ units to _____ units. 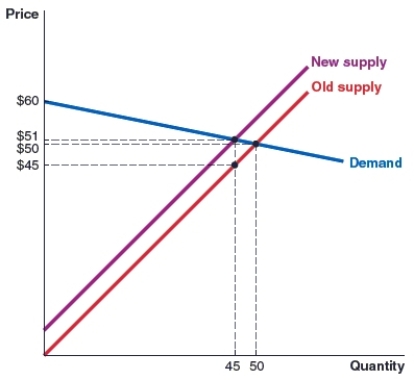
A) 50, 45
B) 45, 51
C) 50, 51
D) 45, 50
Correct Answer:
Verified
Q8: The statutory burden of a tax is
Q9: The economic burden of a tax is
Q10: (Figure: Tax on Seller) In the graph
Q11: (Figure: Tax on Seller) In the graph
Q12: (Figure: Tax on Seller) In the graph
Q14: (Figure: Tax on Sellers of Soft Drinks)
Q15: (Figure: Tax on Sellers of Soft Drinks)
Q16: (Figure: Tax on Sellers of Soft Drinks)
Q17: (Figure: Tax on Sellers of Soft Drinks)
Q18: (Figure: Tax on Sellers of Soft Drinks)
Unlock this Answer For Free Now!
View this answer and more for free by performing one of the following actions

Scan the QR code to install the App and get 2 free unlocks

Unlock quizzes for free by uploading documents