(Figure: The Market for Amazon Echo) Use Figure: The Market for Amazon Echo. The figure shows the pre-tax and post-tax positions-S1 and S2, respectively-of the supply curve for the Amazon Echo. The tax imposed on the Amazon Echo is equal to: 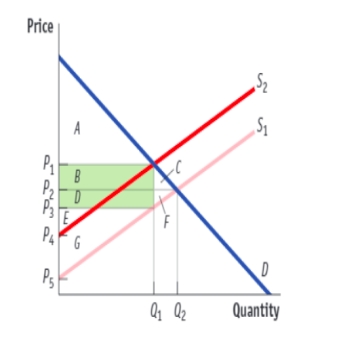
A) P1 − P2.
B) P1 − P3.
C) P2 − P3.
D) P1 − P5.
Correct Answer:
Verified
Q179: (Figure: The Market for Skateboards) Use Figure:
Q180: (Figure: The Market for Skateboards) Use Figure:
Q181: (Figure: The Market for Skateboards) Use Figure:
Q182: (Figure: The Market for Skateboards) Use Figure:
Q183: Suppose the demand for prescription drugs is
Q185: (Figure: Rent Controls in the Market for
Q186: (Figure: Rent Controls in the Market for
Q187: (Figure: Rent Controls in the Market for
Q188: (Figure: Rent Controls in the Market for
Q189: (Figure: Rent Controls in the Market for
Unlock this Answer For Free Now!
View this answer and more for free by performing one of the following actions

Scan the QR code to install the App and get 2 free unlocks

Unlock quizzes for free by uploading documents