(Figure: Demand Curve for Insulin) Use Figure: Demand Curve for Insulin. The figure shows a demand curve that is: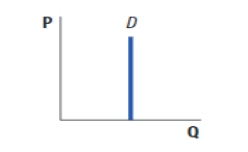
A) unit-elastic.
B) elastic.
C) perfectly inelastic.
D) perfectly elastic.
Correct Answer:
Verified
Q125: (Figure: Demand for High End Cell Phones)
Q126: (Figure: Demand for High End Cell Phones)
Q127: (Figure: Demand for High End Cell Phones)
Q128: If an increase in the price of
Q129: (Figure: Demand Curve for Pears) Use Figure:
Q131: When the percentage change in price is
Q132: If the price of herring increases by
Q133: (Figure: Estimating Price Elasticity in the Market
Q134: (Figure: Estimating Price Elasticity in the Market
Q135: (Figure: Estimating Price Elasticity in the Market
Unlock this Answer For Free Now!
View this answer and more for free by performing one of the following actions

Scan the QR code to install the App and get 2 free unlocks

Unlock quizzes for free by uploading documents