(Figure: Market for New Housing in Dubai) Which graph shows the effect on the supply curve for new housing in Dubai, if economists predict a decrease in demand for new housing?
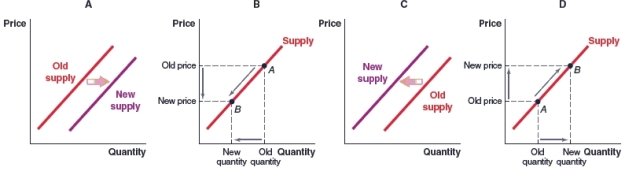
A) Graph A
B) Graph B
C) Graph C
D) Graph D
Correct Answer:
Verified
Q57: (Figure: Market for Drones) If companies frequently
Q58: (Figure: Market for Tropicana Juices) Tropicana produces
Q59: (Figure: Market for Tropicana Juices) Tropicana produces
Q60: (Figure: Market for Steel Bars) Which graph
Q61: (Figure: Market for Luxury SUVs) Which of
Q63: A large amount of harvested grain used
Q64: (Figure: Market for Furniture) Which graph shows
Q65: (Figure: Market for Automobiles) Which graph shows
Q66: How will the supply of clothing change
Q67: How will the supply of clothing change
Unlock this Answer For Free Now!
View this answer and more for free by performing one of the following actions

Scan the QR code to install the App and get 2 free unlocks

Unlock quizzes for free by uploading documents