(Figure: Market for Roses) Which graph shows what will happen to the supply of roses if the price of roses falls?
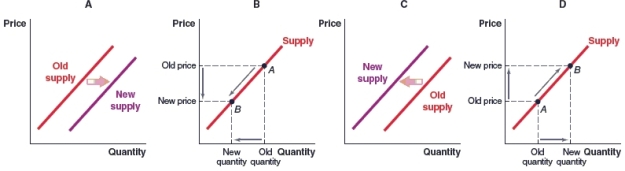
A) Graph A
B) Graph B
C) Graph C
D) Graph D
Correct Answer:
Verified
Q64: (Figure: Market for Furniture) Which graph shows
Q65: (Figure: Market for Automobiles) Which graph shows
Q66: How will the supply of clothing change
Q67: How will the supply of clothing change
Q68: (Figure: Market for Printing Paper) Which of
Q70: Peanut butter and peanut oil are complements-in-production.
Q71: Due to a decline in demand and
Q72: (Figure: Market for Stevia) Stevia is a
Q73: (Figure: Market for Bread) Which of the
Q74: (Figure: Market for Lenovo Desktops) Lenovo produces
Unlock this Answer For Free Now!
View this answer and more for free by performing one of the following actions

Scan the QR code to install the App and get 2 free unlocks

Unlock quizzes for free by uploading documents