(Figure: Leonard's Demand for Pecan Pie) Look at Leonard's weekly demand curve for slices of pie. How many slices of pie is Leonard willing to buy at $2 per slice? 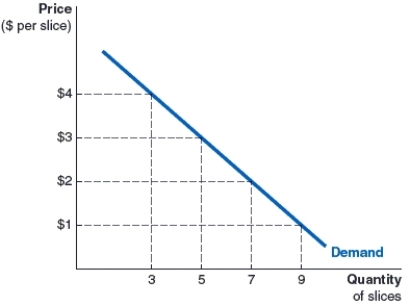
A) 3 slices
B) 9 slices
C) 7 slices
D) 5 slices
Correct Answer:
Verified
Q1: An individual demand curve is a graph:
A)that
Q2: Quantity demanded is on the horizontal axis
Q3: (Figure: Leonard's Demand for Pecan Pie) Look
Q5: (Figure: Mia's Demand Curve for Ice Cream)
Q6: (Figure: Mia's Demand Curve for Ice Cream)
Q7: Why does the demand curve slope downwards?
A)It
Q8: A downward-sloping demand curve implies:
A)there is an
Q9: The law of demand refers to
A)the positive
Q10: Which of the following scenarios does not
Q11: Which of the following scenarios illustrates the
Unlock this Answer For Free Now!
View this answer and more for free by performing one of the following actions

Scan the QR code to install the App and get 2 free unlocks

Unlock quizzes for free by uploading documents