The table shows the monthly individual demand schedules of four students for soda. What is the change in the total market demand for soda when the price changes from $1.50 per can to $2 per can? 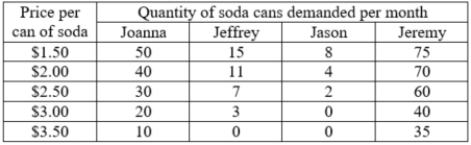
A) The total quantity demanded in the market falls by 23 cans.
B) The total quantity demanded in the market rises by 26 cans.
C) The total quantity demanded in the market falls by 18 cans.
D) The total quantity demanded in the market rises by 23 cans.
Correct Answer:
Verified
Q19: Diminishing marginal benefit:
A)is when buying an additional
Q20: Diminishing marginal benefit
A)does not affect a buyer's
Q21: On a hot sweltering day, you feel
Q22: The table shows the monthly individual demand
Q23: The table contains the monthly demand for
Q25: The table contains the monthly demand for
Q26: As part of a market research
Q27: As part of a market research
Q28: As a part of a market
Q29: As part of a market research
Unlock this Answer For Free Now!
View this answer and more for free by performing one of the following actions

Scan the QR code to install the App and get 2 free unlocks

Unlock quizzes for free by uploading documents