(Figure: Graph) Refer to the graph to answer the question. In the graph, the movement from point M to point Q represents 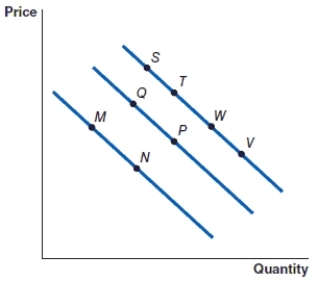
A) a decrease in demand.
B) a decrease in quantity demanded.
C) an increase in quantity demanded.
D) an increase in demand.
Correct Answer:
Verified
Q28: As a part of a market
Q29: As part of a market research
Q30: What is the process that a manager
Q31: (Figure: Graph) Refer to the graph to
Q32: (Figure: Graph) Refer to the graph to
Q34: (Figure: Graph) Refer to the graph to
Q35: (Figure: Graph) Refer to the graph to
Q36: (Figure: Graph) Refer to the graph to
Q37: (Figure: Graph) Refer to the graph to
Q38: (Figure: Graph) Refer to the graph to
Unlock this Answer For Free Now!
View this answer and more for free by performing one of the following actions

Scan the QR code to install the App and get 2 free unlocks

Unlock quizzes for free by uploading documents