(Figure: Butter and Jam) Some people like to eat jam and butter sandwiches, and for them, these two foods are complementary goods. For these people, which of the graphs illustrates the impact of a fall in the price of butter on the jam market?
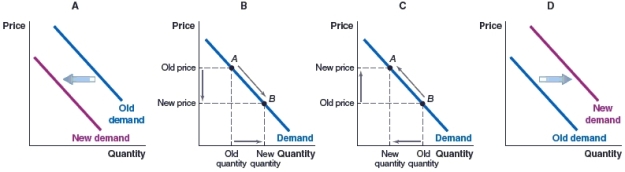
A) Graph A
B) Graph B
C) Graph C
D) Graph D
Correct Answer:
Verified
Q49: Recent evidence suggests exercise promotes longevity and
Q50: In March 2019, airlines around the world
Q51: (Figure: Leather Wallets) Fossil has started an
Q52: (Figure: Demand for Bus Rides) The city
Q53: (Figure: Peanut Butter and Jelly) In the
Q55: (Figure: Demand for Rental Housing) Fort Collins,
Q56: (Figure: Market for Luxury Vehicles) Which graph
Q57: (Figure: Market for Holiday Cruises) Which graph
Q58: (Figure: Market for High-End Meals) What will
Q59: (Figure: Market for Community College) Which graph
Unlock this Answer For Free Now!
View this answer and more for free by performing one of the following actions

Scan the QR code to install the App and get 2 free unlocks

Unlock quizzes for free by uploading documents