(Figure: Demand for Rental Housing) Fort Collins, CO is experiencing net immigration of people into the area. Which of the following graphs illustrates the impact of this net immigration on the demand for rental housing?
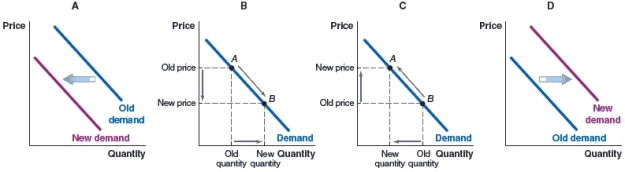
A) Graph A
B) Graph B
C) Graph C
D) Graph D
Correct Answer:
Verified
Q50: In March 2019, airlines around the world
Q51: (Figure: Leather Wallets) Fossil has started an
Q52: (Figure: Demand for Bus Rides) The city
Q53: (Figure: Peanut Butter and Jelly) In the
Q54: (Figure: Butter and Jam) Some people like
Q56: (Figure: Market for Luxury Vehicles) Which graph
Q57: (Figure: Market for Holiday Cruises) Which graph
Q58: (Figure: Market for High-End Meals) What will
Q59: (Figure: Market for Community College) Which graph
Q60: (Figure: Market for New Housing) Which of
Unlock this Answer For Free Now!
View this answer and more for free by performing one of the following actions

Scan the QR code to install the App and get 2 free unlocks

Unlock quizzes for free by uploading documents