(Figure: Market for New Housing) Which of the graphs shows the effect on the housing market today, if the realtor association predicts new housing prices to fall in a few months?
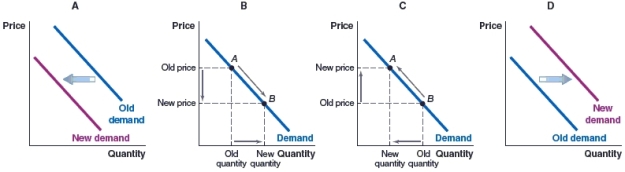
A) Graph A
B) Graph B
C) Graph C
D) Graph D
Correct Answer:
Verified
Q55: (Figure: Demand for Rental Housing) Fort Collins,
Q56: (Figure: Market for Luxury Vehicles) Which graph
Q57: (Figure: Market for Holiday Cruises) Which graph
Q58: (Figure: Market for High-End Meals) What will
Q59: (Figure: Market for Community College) Which graph
Q61: (Figure: Market for New Housing) Which graph
Q62: (Figure: Market for Printing Paper) Which of
Q63: (Figure: Market for Roses) Which graph illustrates
Q64: If Tesla cars become less expensive, what
Q65: (Figure: Market for Stevia) Stevia is a
Unlock this Answer For Free Now!
View this answer and more for free by performing one of the following actions

Scan the QR code to install the App and get 2 free unlocks

Unlock quizzes for free by uploading documents