(Figure: Demand for Bananas) Use Figure: Demand for Bananas. A decreased preference for bananas could be represented as a:
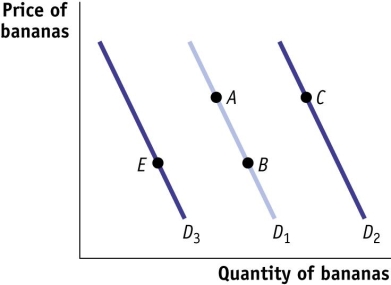
A) shift from D1 to D2.
B) movement from point A to point B.
C) shift from D1 to D3.
D) movement from point B to point E.
Correct Answer:
Verified
Q137: Suppose that, upon changing jobs, you experience
Q138: The demand for bottled water decreases at
Q139: The demand curve for meals at a
Q140: If the price of peanut butter were
Q141: (Figure: Demand for Bananas) Use Figure: Demand
Q143: (Figure: Demand for Bananas) Use Figure: Demand
Q144: (Table: The Demand for Potato Chips) Use
Q145: (Table: The Demand for Potato Chips) Use
Q146: (Table: The Demand for Potato Chips) Use
Q147: (Table: The Demand for Potato Chips) Use
Unlock this Answer For Free Now!
View this answer and more for free by performing one of the following actions

Scan the QR code to install the App and get 2 free unlocks

Unlock quizzes for free by uploading documents