Which of the following figures shows the correct typical shape of the consumption function? 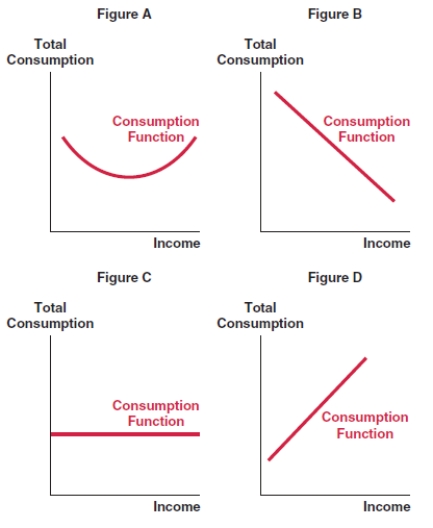
A) Figure A
B) Figure B
C) Figure C
D) Figure D
Correct Answer:
Verified
Q3: Consumption refers to the:
A)purchases of goods and
Q4: Planned investment refers to the:
A)total investment.
B)intentional expenditures
Q5: The difference between total investment and planned
Q6: The relationship between consumption and income is:
A)sometimes
Q7: The slope of the consumption function is:
A)always
Q9: The consumption function is:
A)the relationship between aggregate
Q10: A movement along the same aggregate expenditure
Q11: Consumption is $3,500 when income is $4,000,
Q12: Consumption is $3,600 when income is $4,000,
Q13: Consumption is $5,900 when income is $6,000,
Unlock this Answer For Free Now!
View this answer and more for free by performing one of the following actions

Scan the QR code to install the App and get 2 free unlocks

Unlock quizzes for free by uploading documents