Which figure shows the impact of a rise in the marginal propensity to consume (MPC) on the aggregate expenditure function?
A) 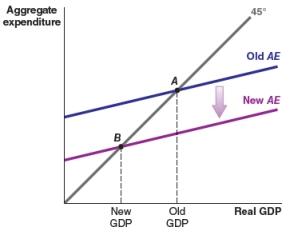
B) 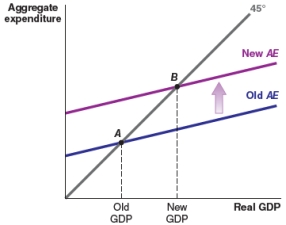
C) 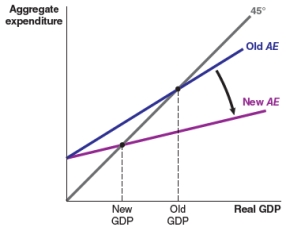
D) 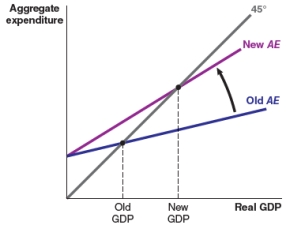
Correct Answer:
Verified
Q42: A rise in the marginal propensity to
Q43: Which of the following figures shows the
Q44: Which of the following figures shows the
Q45: Which of the following figure shows the
Q46: The U.S. dollar appreciates, leading to a
Q48: Which figure shows the impact of a
Q49: If the Federal Reserve raises interest rates:
A)consumption
Q50: If the federal government lowers government expenditure:
A)aggregate
Q51: If the Federal Reserve lowers interest rates:
A)the
Q52: If the federal government raises government expenditure:
A)aggregate
Unlock this Answer For Free Now!
View this answer and more for free by performing one of the following actions

Scan the QR code to install the App and get 2 free unlocks

Unlock quizzes for free by uploading documents