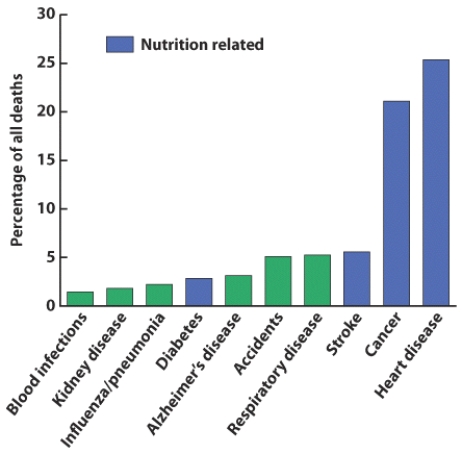
This graph illustrates the percent of deaths in the US from various diseases. Choose one of the diseases listed in this table and discuss the dietary choices people are making that may contribute to this disease. What is a realistic way that someone at risk for this disease could emphasize in their diet to help prevent this from occurring?
Correct Answer:
Verified
Q73: Sara is perplexed by the following situation
Q74: Shanna had a Pop Tart for breakfast
Q75: Define nutrigenomics and its value in treating
Q76: A proposed explanation for an observation is
Q77: Oftentimes food is used to commemorate milestones
Q79: According to the graph, 1 cup of
Q80: A varied diet also balances the calories
Q81: One option to encourage healthier food choices
Q82: Who is responsible for the poor dietary
Q83: One option to encourage healthier food choices
Unlock this Answer For Free Now!
View this answer and more for free by performing one of the following actions

Scan the QR code to install the App and get 2 free unlocks

Unlock quizzes for free by uploading documents