This graph illustrates the sources of salt in our diets. Which of the following would be the best strategy to reduce salt in the diet? 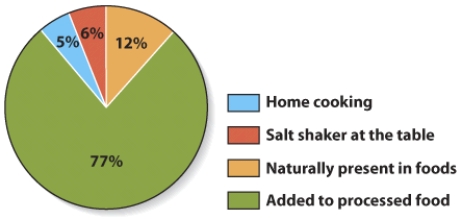
A) Choose foods that are lower in sodium when reading food labels.
B) Do not put so much salt in water when cooking.
C) Identify the foods that are naturally high in sodium and do not eat so much of those foods.
D) Use the salt shaker at the table in lower amounts.
Correct Answer:
Verified
Q40: Which of the following does NOT increase
Q41: How does the small amount of sodium
Q42: Which of the following is NOT associated
Q43: Aldosterone increases sodium reabsorption by the kidneys.
Q44: If you cut back on your salt
Q46: Which of the following is FALSE about
Q47: Based on the information in this graph,
Q48: Which of the following minerals are emphasized
Q49: The health problem most commonly associated with
Q50: Outward symptoms of hypertension include which of
Unlock this Answer For Free Now!
View this answer and more for free by performing one of the following actions

Scan the QR code to install the App and get 2 free unlocks

Unlock quizzes for free by uploading documents