This graph charts the growth rate of the infant. Which of the following is the correct interpretation of the information provided in this graph? 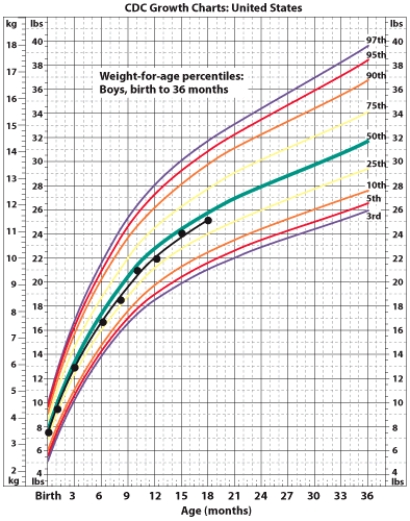
A) The infant's birth weight is much higher than the general population.
B) The infant had weight gain that was much greater than expected from 15 to 18 months of age.
C) The infant's birth weight is lower than the general population and has remained at this percentile into childhood.
D) This infant experienced catch-up growth between 3 and 6 months of age.
Correct Answer:
Verified
Q56: Pregnant teens are at increased risk of
Q57: Oxytocin
A) causes let-down to occur.
B) causes morning
Q58: As compared to the pregnancy recommendations, the
Q59: Based on the breast milk consumption of
Q60: In general, the nutrient needs of a
Q62: As a general rule of thumb, an
Q63: The first milk that is produced by
Q64: Which of the following statements is FALSE?
A)
Q65: Newborn infants are given a shot of
Q66: Because infants change so much during the
Unlock this Answer For Free Now!
View this answer and more for free by performing one of the following actions

Scan the QR code to install the App and get 2 free unlocks

Unlock quizzes for free by uploading documents