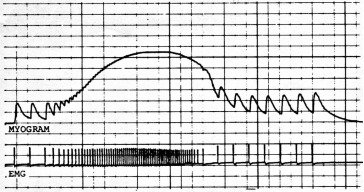
The graph below was generated by students in a physiology lab.The top trace (myogram)shows contraction force, the bottom (EMG)shows the electrical stimulus.On the graph, label a muscle twitch.What property of muscle is being tested here? What caused the increase in force (and subsequent decrease)?
Correct Answer:
Verified
View Answer
Unlock this answer now
Get Access to more Verified Answers free of charge
Q96: Describe the muscle condition called tetanus.Is this
Q97: Sketch and label a relaxed sarcomere, then
Q98: Factors playing a role in fatigue can
Q99: Skeletal muscle fibers with the greatest endurance
Q100: Define and explain the difference between isotonic,
Q102: Smooth muscle cells of blood vessels are
Q103: The interaction between Ca²⁺ and calmodulin in
Q104: You and your lab partner use a
Q105: Sketch a graph of the length-tension relationship
Q106: A certain drug is known to block
Unlock this Answer For Free Now!
View this answer and more for free by performing one of the following actions

Scan the QR code to install the App and get 2 free unlocks

Unlock quizzes for free by uploading documents