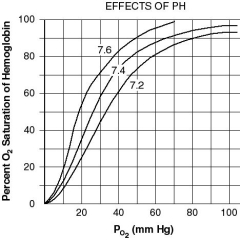
The graph below shows an oxygen dissociation curve, with the normal curve in the center.What is the name of the phenomenon that shifts the curve to the right? What causes this change in oxygen dissociation? Is the shift beneficial or detrimental? Explain.
Correct Answer:
Verified
View Answer
Unlock this answer now
Get Access to more Verified Answers free of charge
Q77: In the science fiction movie The Abyss,
Q78: Blocking afferent action potentials from the chemoreceptors
Q79: Compare and contrast the pulmonary pathologies that
Q80: What are the two possible causes of
Q81: Define hyperventilation and explain what may cause
Q82: Refer to the graph below.

Q83: Which is typically more important in regulating
Q85: Cary deliberately hyperventilates for several minutes before
Q86: Timmy is a cantankerous toddler who has
Q87: Oxygen consumption increases with exercise due to
Unlock this Answer For Free Now!
View this answer and more for free by performing one of the following actions

Scan the QR code to install the App and get 2 free unlocks

Unlock quizzes for free by uploading documents