The following figure illustrates the demand and supply curves for PCs in a small country.
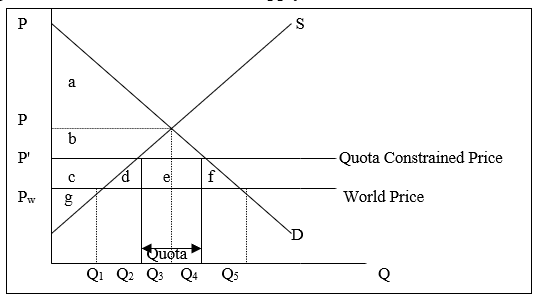
-Suppose the government used a tariff to achieve the same level of protection as the quota illustrated above. Comparing the two outcomes (quota versus tariff) we can conclude:
A) consumers lose area a.
B) the government can collect the tariff or sell the quotas to receive area e.
C) domestic producers gain under both a tariff and a quota.
D) All of the above
E) None of the above
Correct Answer:
Verified
Q10: Nontariff barriers include all of the following
Q11: Which of the following statements is true?
A)
Q12: A VER is imposed by:
A) the domestic
Q13: Which of the following countries has a
Q14: The following figure illustrates the demand and
Q16: The following figure illustrates the demand and
Q17: The following figure illustrates the demand and
Q18: The following figure illustrates the demand and
Q19: The following figure illustrates the demand and
Q20: The following figure illustrates the demand and
Unlock this Answer For Free Now!
View this answer and more for free by performing one of the following actions

Scan the QR code to install the App and get 2 free unlocks

Unlock quizzes for free by uploading documents