Figure 17.1 Supply and Demand Curves for the Swiss Franc
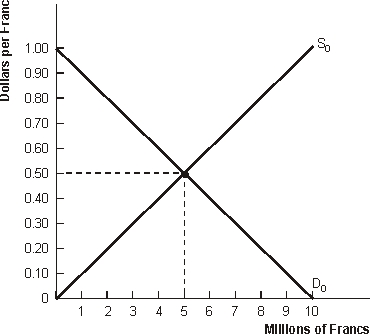
-Refer to Figure 17.1. Suppose the exchange rate is $0.30 per franc. At this exchange rate there is an ______ of francs that leads to a ______ in the dollar price of the franc, a(n) ______ in the quantity of francs supplied, and a(n) ______ in the quantity of francs demanded.
A) excess demand, rise, increase, decrease
B) excess demand, rise, decrease, increase
C) excess supply, fall, decrease, increase
D) excess supply, fall, increase, decrease
Correct Answer:
Verified
Q38: Table 17.2 Foreign Exchange Quotations
Q39: Table 17.2 Foreign Exchange Quotations
Q40: Table 17.2 Foreign Exchange Quotations
Q41: Figure 17.1 Supply and Demand Curves for
Q42: Figure 17.1 Supply and Demand Curves for
Q44: Figure 17.1 Supply and Demand Curves for
Q45: Figure 17.1 Supply and Demand Curves for
Q46: Figure 17.2 The Market for Swiss Francs
Q47: Figure 17.2 The Market for Swiss Francs
Q48: Assume that the U.S. faces an 8
Unlock this Answer For Free Now!
View this answer and more for free by performing one of the following actions

Scan the QR code to install the App and get 2 free unlocks

Unlock quizzes for free by uploading documents