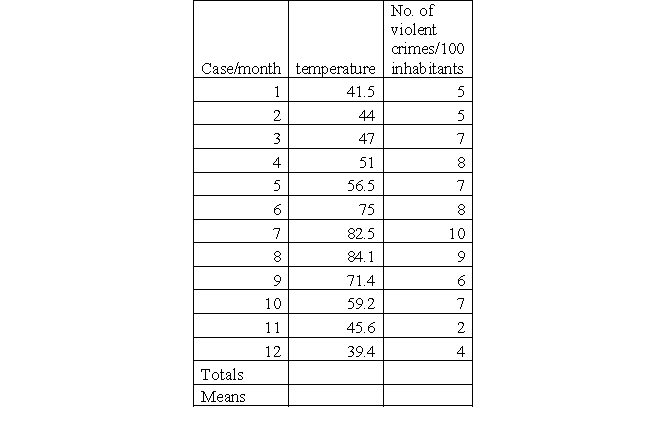
Academic literature found evidence that there is a relationship between temperature and the frequency of the occurrence of violent crimes. Utilizing data derived from the local police department (number of violent crimes/month/100 inhabitants) and meteorological data (average temperature/month), you want to determine the relationship between temperature (IV) and the frequency of violent crime (DV). Find the distribution of both variables in the table below.
a. Use a spreadsheet program to create a scatterplot or draw it by hand. Describe what you see.
b. Compute beta (b) and interpret your result.
c. Compute the constant (a) and interpret your result.
d. Assume you want to predict the frequency of violent crimes in a month with an average temperature of 90.5 degrees Fahrenheit. Compute y.
Correct Answer:
Verified
Q1: To learn about the accuracy of a
Q2: To predict a certain outcome having detailed
Q3: Many formulas utilized in statistics are complex.
Q4: Assume you have computed b = 6.
Q5: To warm up, let us start
Q7: Using the example from problem 2:
a. State
Q8: You are interested in the relationship
Q9: It is debated whether IQ scores
Unlock this Answer For Free Now!
View this answer and more for free by performing one of the following actions

Scan the QR code to install the App and get 2 free unlocks

Unlock quizzes for free by uploading documents