Multiple Choice
Figure 5-1
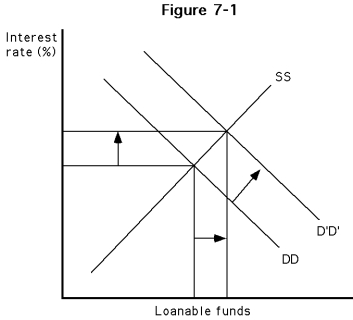
-Which of the following best describes the diagram of Figure 5-1?
A) The demand for loanable funds increased. This, in turn, increased the interest rate and the supply of loanable funds.
B) The demand for loanable funds increased. This, in turn, increased the interest rate and the quantity supplied of loanable funds.
C) The supply of loanable fund increased. In turn, interest rates increased.
D) Interest rates increased, causing the demand of loanable funds to increase.
Correct Answer:
Verified
Related Questions

