Indicate whether questions 5 through 11 are true or false based upon the following diagram.
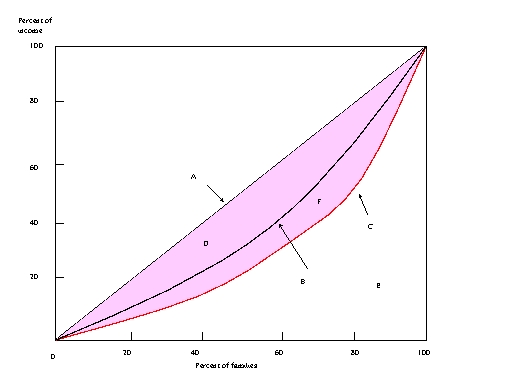
-Line B is the line of perfect inequality.
Correct Answer:
Verified
Q5: There is a clear positive correlation between
Q6: Whites receive average incomes twice as high,
Q7: Statistically speaking, the best odds for having
Q8: Indicate whether questions 5 through 11 are
Q9: Indicate whether questions 5 through 11 are
Q11: Indicate whether questions 5 through 11 are
Q12: Indicate whether questions 5 through 11 are
Q13: Indicate whether questions 5 through 11 are
Q14: Indicate whether questions 5 through 11 are
Q15: The marginal productivity theory suggests that differences
Unlock this Answer For Free Now!
View this answer and more for free by performing one of the following actions

Scan the QR code to install the App and get 2 free unlocks

Unlock quizzes for free by uploading documents