Use the following to answer questions below:
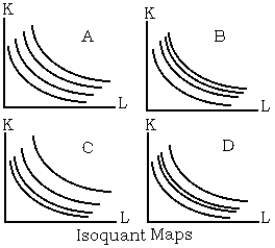
-Refer to the isoquant maps graph. Assume that the four isoquants in each graph represent output levels of 100, 200, 300, and 400. Which of the four graphs shows an isoquant map in which returns to scale are first decreasing and then increasing?
A) Graph D
B) Graph C
C) Graph B
D) None of the above is correct.
Correct Answer:
Verified
Q7: Use the following to answer questions below:
Q8: Use the following to answer questions below:
Q9: Use the following to answer questions below:
Q10: Use the following to answer questions below:
Q11: Use the following to answer questions below:
Q13: Use the following to answer questions below:
Q14: Use the following to answer questions below:
Q15: Use the following to answer questions below:
Q16: Use the following to answer questions below:
Q17: Use the following to answer questions below:
Unlock this Answer For Free Now!
View this answer and more for free by performing one of the following actions

Scan the QR code to install the App and get 2 free unlocks

Unlock quizzes for free by uploading documents