Figure 8.2
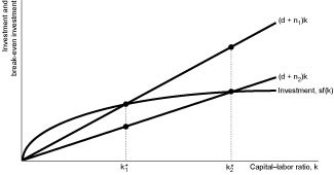
-Refer to Figure 8.2.Suppose the economy is originally in steady state at k*₁.All else equal,if the labour force growth rate decreases,the change in the capital-labour ratio is represented by the vertical distance between
A) sf(k) and (d + n₂) k.
B) sf(k) and (d + n₁) k.
C) (d + n₁) k and (d + n₂) k.
D) k*₂ and (d + n₂) k.
Correct Answer:
Verified
Q23: Figure 8.1 Q24: What is depreciation,and what happens to the Q25: If the saving rate increases,break-even investment will Q26: If the capital-labour ratio is below the Q27: Figure 8.2 Q29: Suppose k = y¹/⁴,total factor productivity is Q30: The break-even investment line becomes flatter when Q31: If d = the depreciation rate,n = Q32: Describe the steady state in the Solow Q33: Figure 8.2 Unlock this Answer For Free Now! View this answer and more for free by performing one of the following actions Scan the QR code to install the App and get 2 free unlocks Unlock quizzes for free by uploading documents
![]()
![]()
![]()

