Figure 11.2
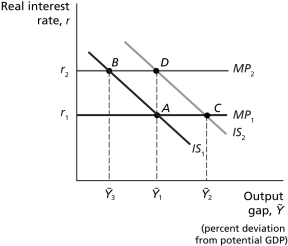
-Refer to Figure 11.2..Assume the economy is in equilibrium at Ȳ₁,where real GDP equals potential GDP,and then the economy experiences a positive demand shock.Other things equal,the positive demand shock is best represented by a(n)
A) movement up along the Phillips curve.
B) movement down along the Phillips curve.
C) upward shift of the Phillips curve.
D) downward shift of the Phillips curve.
Correct Answer:
Verified
Q21: Figure 11.2 Q22: Suppose the economy is in equilibrium with Q23: Figure 11.1 Q24: Figure 11.2 Q25: Suppose the economy is in equilibrium with Q27: Assume the expected inflation for this year Unlock this Answer For Free Now! View this answer and more for free by performing one of the following actions Scan the QR code to install the App and get 2 free unlocks Unlock quizzes for free by uploading documents
![]()
![]()
![]()

