Figure 12.4
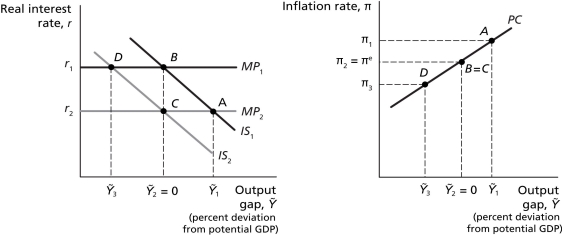
Scenario: The above figures represent the economy of Mondolvia, where points A, B, C, and D in the first figure reflect the corresponding points in the second figure. The economy of Mondolvia is initially at equilibrium with real GDP equal to potential GDP. In April 2012, Mondolvia reached the peak of a rapid housing bubble that dramatically increased consumer wealth. The central bank of Mondolvia recognized this housing bubble peak existed in June, 2012 and implemented corrective policy in August 2012. The corrective policy actually changed output in the economy 12 months after it was implemented. In the meantime, the housing bubble burst in December 2012, returning the economy back to its initial, pre-bubble equilibrium level.
-Refer to Figure 12.4.Since the housing bubble burst and the economy returned to its initial,pre-bubble level before the corrective policy changed output,the economy actually moved from ________ after the bubble burst.
A) point A to point B
B) point B to point D
C) point A to point C
D) point C to point B
Correct Answer:
Verified
Q42: Suppose oil prices suddenly begin to rise
Q43: Suppose the economy is initially above potential
Q44: If the Bank of Canada decides to
Q45: Suppose the economy is initially at full
Q46: If the Bank of Canada is facing

