State the type of graphical display for Graph A and GraphB. 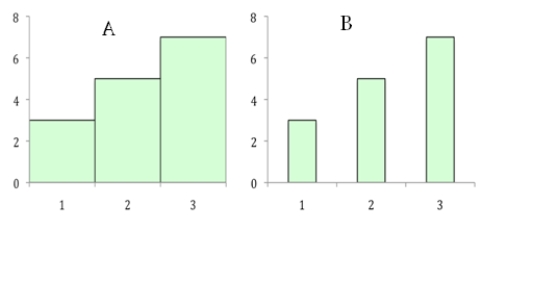
A) A is a bar chart; B is a histogram.
B) B is a bar chart; A is a histogram.
C) Both graphs are bar charts.
D) Both graphs are histograms.
Correct Answer:
Verified
Q44: The data should be grouped for the
Q45: Ungrouped data are always distributed in intervals.
Q46: A researcher records the number of children
Q47: The real range is the difference between
Q48: A researcher measures the time (in seconds)it
Q50: An open class is permitted when outliers
Q51: State the original data displayed in the
Q52: Grouped data are used to summarize quantitative
Q53: A researcher measures the weight (in ounces)of
Q54: Bar charts are a lot like histograms,except
A)
Unlock this Answer For Free Now!
View this answer and more for free by performing one of the following actions

Scan the QR code to install the App and get 2 free unlocks

Unlock quizzes for free by uploading documents